整理切面图包括纬度-时间剖面图,经度-时间剖面图,高度-经度剖面图,高度-纬度剖面图以及一些特殊的绘图函数。
一、特殊的绘图函数
只画某些等值线内的内容
res@gsnShadeFillType    = "color" or "pattern"
res@gsnShadeFillScaleF  = 当fill type 为 pattern时,浮点数,数值大于1时,值越大,填充的形状数量越疏
res@gsnShadeLow     = a pattern or color index    ;用于填充等值线小于lowval的区域,若不设置则该区域不填充
res@gsnShadeMid     = a pattern or color index    ;用于填充等值线介于lowval和highval的区域,若不设置则该区域不填充
res@gsnShadeHigh    = a pattern or color index    ;用于填充等值线大于highval的区域,若不设置则该区域不填充
plot = gsn_contour_shade(plot, lowval, highval, res )  ;lowval和highval都是一个数值
;该函数是叠加在已有的图(但该图并没有draw和frame)之上
只画通过显著性检验的数据
;mask(array, marray, mvalue),当marray某些位置上的值同mvalue时,mask会保留array数组中相应位置上的数值,其余设为缺测
var = mask(var,prob.lt.siglvl,True) ;prob是统计概率值,维数与var相同。该函数会保留prob小于siglvl的值。
;若siglvl为0.05,则未通过95%显著性检验的数据将被设置为缺测值

;where函数与mask有些类似,但他是替换数据,将满足条件的设为一个值,不满足条件的设为另外一个值
y = where(y.ne.0, y, y@_FillValue) ;保留y不等于0的数值,将y等于0的设为缺测。
在用prob画显著性区域时,一定要先设置prob的lat和lon坐标,否则显著性区域会与实际不符 copy_VarMate(var,prob)
画风场时,一般认为径向风和纬向风中只要有一个方向通过显著性检验则认为过检。若要在全风场中将过检验的矢量换一种颜色表示,可以将过显著的风和没过显著的风分开画
u_unsig = mask(u,((probu.lt.siglvl).or.(probv.lt.siglvl)),False) ;保留没过显著的风
v_unsig = mask(u,((probu.lt.siglvl).or.(probv.lt.siglvl)),False)
u_sig = mask(u,((probu.lt.siglvl).or.(probv.lt.siglvl)),True) ;保留过显著的风
v_sig = mask(u,((probu.lt.siglvl).or.(probv.lt.siglvl)),True)
负值等值线和正值等值线线型颜色不同
;1、通过设置res的属性来改变负值的线型
 res@gsnContourZeroLineThicknessF = 0 	    ; eliminates zero contour
 res@gsnContourNegLineDashPattern = 1       ; sets negative contours to dash pattern 1
 res@gsnContourPosLineDashPattern = 0       ; sets positive contours to dash pattern 0

 ;2、通过绘图函数来统一设定负值和正值的不同颜色
 plot = gsn_csm_contour_map_polar(wks,regres_t,res)
 plot = ColorNegDashZeroPosContour(plot,"red","magenta","blue")
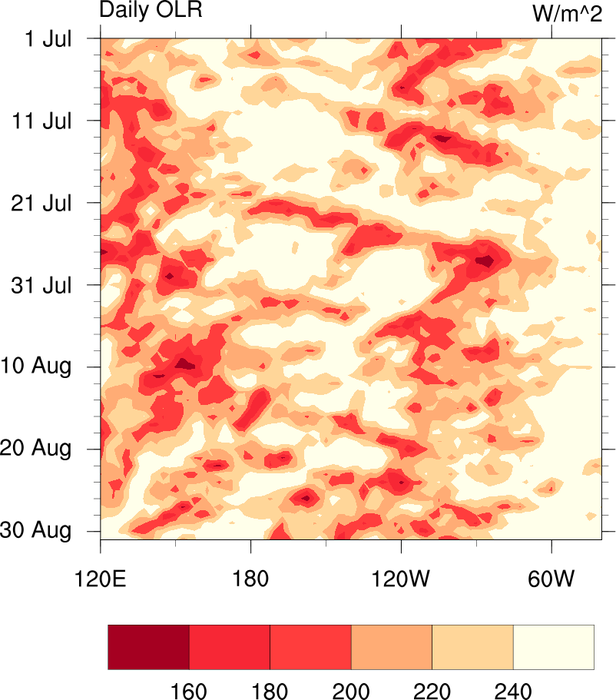
二、纬度(经度)-时间剖面图
plot = gsn_csm_lat_time( wks, data, res ) ;data必须为(lat,time)的二维数组
plot = gsn_csm_time_lat( wks, data, res ) ;data必须为(time,lat)的二维数组
plot = gsn_csm_hov( wks, data, res)       ;data必须为(time,lon)的二维数组
If the resource cnFillOn is set to True, then the following will happen automatically:
- a labelbar will be automatically added (default horizontal)
- contour line labels will be turned off
- the contour information label will be turned off
If you want to turn the labelbar off, set lbLabelBarOn to False.
三、时间坐标轴的标注
1、最常用的,一般时间坐标是从0开始的数字,若要表示具体的年月日,需要自己指定横坐标
res@tmYLMode = "Explicit"
res@tmYLValues = (/ 0. , 30., 61., 89., 120., 150. /)
res@tmYLLabels = (/"DEC","JAN","FEB","MAR","APR","MAY" /)
2、用time_axis_labels函数,其用法如下:
; Set special resources for the time axis
  resTick                = True
  resTick@ttmFormat      = "%d %c"
  resTick@ttmAxis        = "YL"
  resTick@ttmMajorStride = 10

; Set resources necessary to customize Y axis labels
  time_axis_labels( data&time,  res, resTick )
生成的图如下:
 支付宝鼓励
支付宝鼓励  鸡腿鸡腿
鸡腿鸡腿