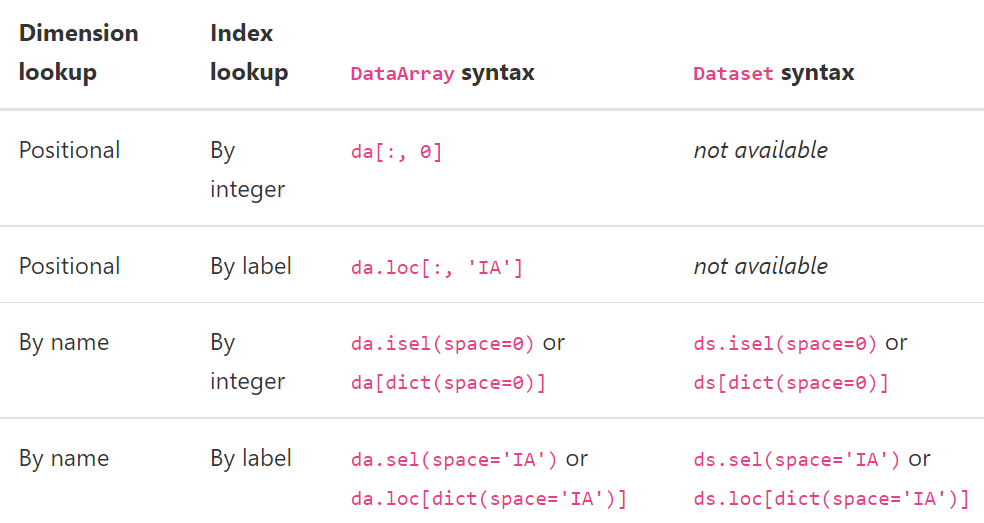
dimension:维度
coordinate:坐标
一个维度可以被赋予多个坐标,因此一般坐标数量多于纬度数
DataArray数组创建
data = np.random.rand(4, 3)
locs = ["IA", "IL", "IN"]
times = pd.date_range("2000-01-01", periods=4)
foo = xr.DataArray(data, coords=[times, locs], dims=["time", "space"])
foo = xr.DataArray(data, coords=[("time", times), ("space", locs)])
foo.attrs['units']='mm/day' # 修改或创建数据属性参数
del foo.attrs['projection'] # 删去某个属性
foo.drop('time',dim=None) # 删去time维对应的坐标,但保留维度
foo.rename({'dayofyear':'time'}) # 修改某个纬度的名字
foo.coords['time'] = times # 修改某个维度的坐标

foo.dtype # dtype('float32')
foo.dims # ('time', 'space')
var.shape # (10248, 1, 256, 512)
var.min()
Dataset数组创建
temp = 15 + 8 * np.random.randn(2, 2, 3)
precip = 10 * np.random.rand(2, 2, 3)
lon = [[-99.83, -99.32], [-99.79, -99.23]]
lat = [[42.25, 42.21], [42.63, 42.59]]
ds = xr.Dataset(
	{
	       "temperature": (["x", "y", "time"], temp),
               "precipitation": (["x", "y", "time"], precip),
	},
	coords={
		"lon": (["x", "y"], lon),
                "lat": (["x", "y"], lat),
                "time": pd.date_range("2014-09-06", periods=3),
                "reference_time": pd.Timestamp("2014-09-05"),
	},
)

# Dictionary like methods to update a dataset
ds = xr.Dataset()
ds["temperature"] = (("x", "y", "time"), temp)
ds["temperature_double"] = (("x", "y", "time"), temp * 2)
ds["precipitation"] = (("x", "y", "time"), precip)
ds.coords["lat"] = (("x", "y"), lat)
ds.coords["lon"] = (("x", "y"), lon)
ds.coords["time"] = pd.date_range("2014-09-06", periods=3)
ds.coords["reference_time"] = pd.Timestamp("2014-09-05")

ds = da.to_dataset(name="temp") #将da这个DataArray加入到ds这个数据组中,并命名为 temp
ds.to_netcdf(fileout+varname+".nc","w") #存储ds文件

# the use of pipe
plt.plot((2 * ds.temperature.sel(x=0)).mean("y"))
(ds.temperature.sel(x=0).pipe(lambda x: 2 * x).mean("y").pipe(plt.plot))
To remove a dimension or a variable, you can use below method, which will return a new dataset. Any variables using that dimension are dropped:
ds_new = ds.drop_vars("temperature")
ds_new = ds.drop_dims("time")

ds_new.coords['month']=range(1,13,1) # add a new dimension
indexing, isin and groupby

import xarray as xr
import numpy as np
lonl=0
lonr=150
lats=15
latn=70

ds  = xr.open_dataset("ERA5_precip_1hr_dec-jan1989.nc")
lat = ds.latitude
lon = ds.longitude
ilon = lon[(lon>=lonl) & (lon<=lonr)]
ilat = lat[(lat>=lats) & (lat<=latn)]
term = ds['tp'][0,:,:]
term = ds['tp'].sel(time=ds.time.dt.year.isin(1989),longitude=ilon,latitude=ilat)
# <xarray.DataArray 'tp' (time: 8760, latitude: 221, longitude: 601)>
term.mean(('latitude','latitude'))

term.sel(time=slice("2000-01-01", "2000-01-02"))
var = term.sel(time=term.time.dt.month.isin(1)).mean("time")
term.loc[ct,:,:] = term.sel(time=ct).mean('time')
# loc是定位,sel是截取部分变量

# calculate monthly data
var = term.groupby(term.time.dt.month)
# DataArrayGroupBy, grouped over 'month'
# 12 groups with labels 1, 2, 3, 4, 5, 6, 7, 8, 9, 10, 11, 12.
print(var.sum("time"))
# <xarray.DataArray 'tp' (month: 12, latitude: 221, longitude: 601)>

ds1=ds.groupby(ds.time.dt.month).mean('time')
ds1=ds.groupby('time.month').mean('time')
ds1=da.groupby('time.dayofyear').mean('time') # 365天
ds_weighted = (ds * weights).groupby('time.season').sum(dim='time') # 'DJF' 'JJA' 'MAM' 'SON'
读取多个nc文件
fs = xr.open_mfdataset(file_string, combine='nested', concat_dim='time', parallel=True)
# file_string 可以是一个字符串“path/to/my/files/*.nc”,也可以是文件路径列表
# combine 有两种选项 "by_coords" 和 "nested"
# concat_dim 表示将文件沿某一维度连接,只有 combine='nested' 时需要提供这一选项。
# 若concat_dim是已存在的维度,则文件沿该维度连接,若concat_dim是不存在的维度,则文件沿新的维度连接

var = fs['temp'].data
term=[var[i:i+3,:,:].sum(axis=0) for i in range(0,25587,3)] # 得到一个list
var1 = np.array(term).reshape(8529*nlat*nlon) #转成一维数组
读取grib数据
主要依赖的库是 https://pypi.org/project/cfgrib/ ,该库可以把grib文件投影到netcdf格式。
可以搭配xarray使用,使用方法如下。可以一次读取一个文件,也可以用xr.open_mfdataset读取多个文件,其他用法同netcdf
ds = xr.open_dataset('example.grib', engine='cfgrib')
print(ds)

# 目前cfgrib库无法同时读取多个typeOfLevel,因此需要根据提示筛选我们需要的数据。
# 这个typeOfLevel可以是isobaricInhPa,surface,depth_below_land
ds = xr.open_dataset('example.grib2', engine="cfgrib", backend_kwargs={'filter_by_keys': {'typeOfLevel': 'isobaricInhPa'}})
print(ds)
默认情景下,cfgrib会输出一个index文档(后缀为.idx),该索引文档可随时删除它们,并在出现问题时重试。 当grib文件所处目录不支持写入文件时,即cfgrib无法在该目录下保存索引文档,此时便会出现如下报错信息,但该报错信息不影响grib数据的读取。 也可在backend_kwargs中加入’indexpath’:’‘选项来选择不输出该索引文档,此时上述报错信息便会消失。
Can't create file '/home/metctm1/array_hq133/data/drv_fld/era5/20220803-sl.grib.923a8.idx'
Traceback (most recent call last):
  File "/home/metctm1/array/soft/anaconda3/lib/python3.8/site-packages/cfgrib/messages.py", line 343, in from_indexpath_or_filestream
    with compat_create_exclusive(indexpath) as new_index_file:
  File "/home/metctm1/array/soft/anaconda3/lib/python3.8/contextlib.py", line 113, in __enter__
    return next(self.gen)
  File "/home/metctm1/array/soft/anaconda3/lib/python3.8/site-packages/cfgrib/messages.py", line 264, in compat_create_exclusive
    fd = os.open(path, os.O_WRONLY | os.O_CREAT | os.O_EXCL)
PermissionError: [Errno 13] Permission denied: '/home/metctm1/array_hq133/data/drv_fld/era5/20220803-sl.grib.923a8.idx'
Can't read index file '/home/metctm1/array_hq133/data/drv_fld/era5/20220803-sl.grib.923a8.idx'
Traceback (most recent call last):
  File "/home/metctm1/array/soft/anaconda3/lib/python3.8/site-packages/cfgrib/messages.py", line 353, in from_indexpath_or_filestream
    index_mtime = os.path.getmtime(indexpath)
  File "/home/metctm1/array/soft/anaconda3/lib/python3.8/genericpath.py", line 55, in getmtime
    return os.stat(filename).st_mtime
FileNotFoundError: [Errno 2] No such file or directory: '/home/metctm1/array_hq133/data/drv_fld/era5/20220803-sl.grib.923a8.idx'
若要循环处理多个文件,可以先利用list来存储数据,然后再转成numpy进行数学运算
    var = []
    fn_stream = subprocess.check_output(
        'ls %s/%d07*-%s.grib'%(
        indir[0],year,suffix), shell=True).decode('utf-8')
    fn_list = fn_stream.split()

    for itm in fn_list:
        ds = xr.open_dataset(itm,engine='cfgrib',backend_kwargs={
                'filter_by_keys': {'typeOfLevel': 'surface'}})
        var.append(ds[varname].data.tolist())

    var = np.array(var).mean(axis=0)
Masking
da = xr.DataArray(np.arange(16).reshape(4, 4), dims=["x", "y"])
da.where(da.x + da.y < 4)
# 保留满足条件的变量,未满足条件的变量设为nan
# da.where(da.x + da.y < 4,0),会将未满足条件的变量设为0

# output is
# <xarray.DataArray (x: 4, y: 4)>
# array([[ 0.,  1.,  2.,  3.],
#        [ 4.,  5.,  6., nan],
#        [ 8.,  9., nan, nan],
#        [12., nan, nan, nan]])
# Dimensions without coordinates: x, y

da = xr.DataArray([1, 2, 3, 4, 5], dims=["x"])
lookup = xr.DataArray([-1, -2, -3, -4, -5], dims=["x"])
da.where(lookup.isin([-2, -4]), drop=True) # output array([2., 4.])
# 加 drop=True后,未满足条件的变量会被删去,数据结构发生变化
# when done repeatedly, this type of indexing is significantly slower than using sel().
apply_ufunc批量处理多维数组
from scipy import stats
def new_linregress(x, y):
    # Wrapper around scipy linregress to use in apply_ufunc
    slope, intercept, r_value, p_value, std_err = stats.linregress(x, y)
    return np.array([slope, p_value])

a1 = xr.apply_ufunc(new_linregress, t, t,
                       input_core_dims=[['time'], ['time']],
                       output_core_dims=[["parameter"]],
                       vectorize=True,
                       dask="parallelized",
                       output_dtypes=['float64'],
                      )
# dimension of t is (time: 10248, lat: 3, lon: 4)
# a1 is (lat: 3, lon: 4, parameter: 2)

ts=np.zeros([2,3,10248],dtype=float)
locs = ['EA','NA']
month = ['DJF','MAM','JJA']
ts1 = xr.DataArray(ts, coords=[locs,month,t.time], dims=["space","month","time"])

a1 = xr.apply_ufunc(new_linregress, t, ts1,
                       input_core_dims=[['time'], ['time']],
                       output_core_dims=[["parameter"]],
                       vectorize=True,
                       dask="parallelized",
                       output_dtypes=['float64'],
                      )
# a1 is (lat: 3, lon: 4, space: 2, month: 3, parameter: 2)
 支付宝鼓励
支付宝鼓励  鸡腿鸡腿
鸡腿鸡腿